Showing posts with label online shopping. Show all posts

Thursday, 12 January 2017

marketshare and shipping speeds of top 5 ecommerce stores during holiday season

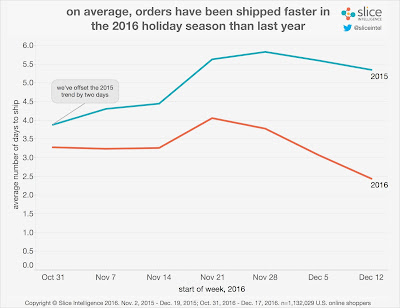
"shipping times have shrunk this holiday season"
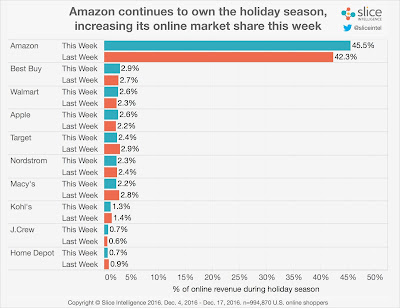
" ecommerce store with highest marketshare during holidays"

New holiday data from Slice Intelligence shows that Amazon has emerged as the undisputed ecommerce store for consumers to shop during the holiday season, with  46%  spending their weekend shopping ( specially during last week of the year) with Amazon .While Consumers weekend shopping list was ready and vying for their attention were the nation's top 10 biggest online shopping sites(See the 2nd chart above) . However  data shows that most preferred  doing their  last year holiday season  online spending  on the amazon platform . The retailer has dominated the entire holiday season and its share increased by 3% 

Best Buy returned to the second-place spot and was followed by Walmart and Apple.Shipping this holiday season also made news as shipping speeds grew faster this holiday season which started shortening as the holiday period progressed.Electronics are once again the top category as 21 percent of all online revenue was generated on tech buys in the past seven days. Apparel purchases follow close behind accounting for 17 percent of last week’s online sales. 

The average package arrives in just three days compared to five days in 2015. Last week’s speed was even faster, with packages arriving in only 2.5 days–much quicker than the 5.5 days during the same time last year.

Tuesday, 15 November 2016

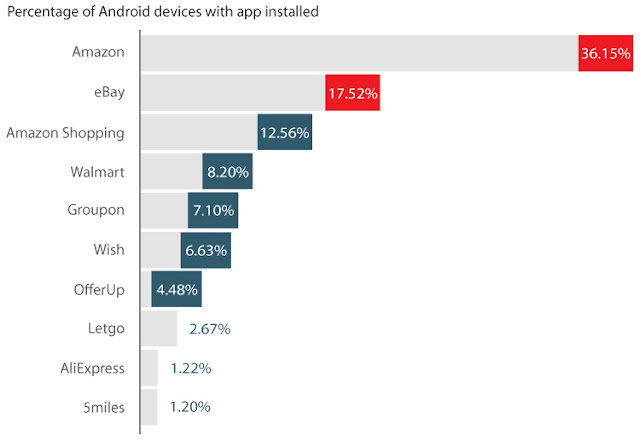
top 10 Android shopping apps by percentage of installs

" top 10 Android shopping apps by percentage of installs"


This data compared the top 10 Android shopping apps by percentage of installs. Amazon takes the first spot followed by ebay,walmart and groupon.According to mobile analytics firm Flurry, shopping app usage grew faster than any other category of apps. Sessions on shopping apps on iOS and Android devices increased by 174% year-over-year, including 220% on Android alone. That’s up from 77% last year.


Utilities and productivity apps were the second-fastest growth category, up 121%, while messaging and social took third place, with 103% growth. Overall app use was up 76%, so all three app categories outpaced the total marketplace (as did apps for health & fitness and travel).

Monday, 14 November 2016

how google mobile index which rolls out today can penalise your shopping website

" google mobile index search changes to impact retailers"

Google is updating its mobile search index to crawl mobile websites to determine their content relevancy in search results, the search giant announced on its official Webmaster blog last week. Google still looks at the desktop versions of the page to evaluate its relevancy to the user on smartphone search results, the search engine says. This is a problem if the mobile site has less content on it than a desktop site
Google basically treated your mobile page as an alternate version of the same content, “The problem is, when shoppers search for a certain product feature or keywords and click on your mobile page from Google but can't find that phrase on the page, they get frustrated at Google for showing irrelevant listings.” This change will impact e-retailers that have a separate mobile site, often referred to as an “m.” site, which is 142 retailers of the 500 merchants ranked in the Internet Retailer 2017 Mobile 500 according to Top500Guide.com. 

Retailers that use responsive design or dynamic serving (another form of responsive design also referred to as hybrid or adaptive design) shouldn’t have to make any changes, Google says. 357 e-retailers use a form of a responsive design in the Mobile 500. 
 So what will this change ?.Although Google wants you to have a mobile site,even if you dont, it will crawl your desktop version instead. Google said, “If you only have a desktop site, we’ll continue to index your desktop site just fine, even if we’re using a mobile user agent to view your site.”However in case you have a mobile site, you need to ensure the" copy ,images and links are similar enough to the desktop version so that Google can consume the proper content and rank your site as well as it did by crawling your desktop site.


Retailers that do have a separate mobile site should use the Google-recommended mobile search engine optimization mark up in its code,according to google mobile best practices guidelines 

Sunday, 13 November 2016

alibaba exceeds $18billlion of gross transaction volume on china's biggest online shopping day

"chinese online shopping volume gross merchandise"

 
2016 China Singles day  online shopping broke all records since the last 9 years of its inception as online shopping revenues exceeded and outperformed 2015 singles day eshopping festival by Alibaba which is celebrated every year in  November 11th.Sales on its e-commerce platform reached 102 billion yuan ($15 billion) shortly before 8 pm in China, easily topping last year’s total of 91.2 billion yuan(,$14.3 billion) with about four hours left to run. This record revenues on a single day dwarfs both America’s Cyber Monday and Black Friday, In 2016, Alibaba passed $14 billion in revenue on Singles’ Day, more than double the $5.8 billion in sales of the combined U.S. e-commerce holidays of Black Friday and Cyber Monday 2015

This year on chines singles day  online shopping by retailers on Alibaba's platforms had recorded $17.8 billion worth of gross merchandise volume (GMV). In 2015, the 24-hour e-commerce sales event racked up $14.3 billion GMV in total.See the online chinese shopping addiction story


To kick off this year’s event, Alibaba Chairman Jack Ma used Chinese pop stars, Victoria’s Secret models and foreign celebrities including Scarlett Johansson,Kobe Bryant and David Beckham to fill a 60,000-person stadium in Shenzhen. The show was telecast live on video-streaming websites across China.

Monday, 7 November 2016

how much did consumer spends on online and retail combine on 5 holidays this year


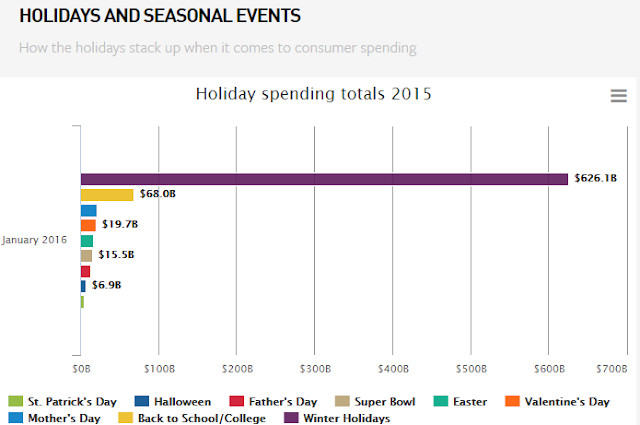
How much did US consumers spend during the -2015-2016  holidays both online and retail combined ?.This year holiday spending included  New year, Valentines day holiday spending , Saint Patricks day, Easter Holidays,Father days, Mothers Day, Back to School ,Halloween. 
Topping the consumer spends list is New Year holidays which saw Americans spending upto $626 billion during the holiday. Back to School holidays saw consumer spend as the second highest as US consumers spent over $68 billion. 
Halloween and Valentine's day shared honors with approx $19billion spends on holiday shopping .Super Bowl saw a spend of  $15 billion while fathers day saw $10 billion of consumer spending in 2016 , followed by Mothers day spends of $5.5 billion
"how much did consumer spends on online and retail combine on 5 holidays this year"

US Consumer spending on 2015-2916 Holidays : Black Friday ,New Year, Halloween,Fathers day,Mothers day,Back to School Holidays


when are consumers in 2016 plan to start shopping:monthwise break up


"monthwise break up of online holiday shopping this year"
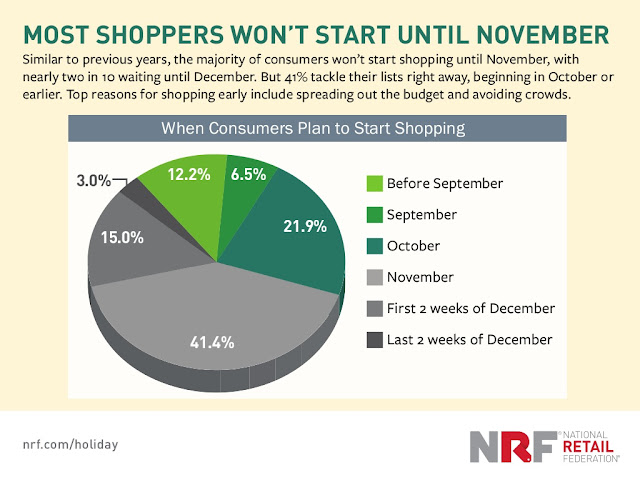
Monthwise break up of  2016 online holiday shopping this year as planned by US Consumers
 41% 
Out of this year  consumers as surveyed by national retail federation are expected to start their 2016 holiday shopping by  November 2016.While 15% consumers are expected to start their black Friday and holiday shopping by first 2 weeks of December, where as just 3%  will start their shopping during  the last 2 weeks of December.
The remaining 19% of holiday shoppers are expected to start their black Friday and thanksgiving shopping by September this year.


The top reason of shopping early is the absence of crowds and comparing online .Dont miss the early 4% of users who say will start their comparison online.

Wednesday, 2 November 2016

retail industry cost per click stabilizes at $1.3, with CTR increasing to 3.46%

"retail industry paid search report"

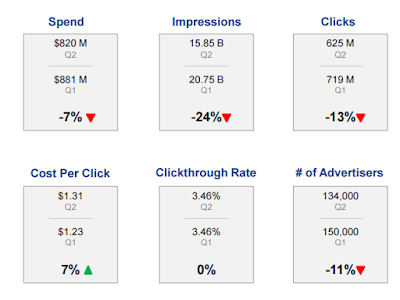
According to the latest Kantar media 2016  paid search data for the retail industry, 134,000 retail advertisers competed for approx 16 billion ad impressions and 625 million clicks with a ctr of 3.46%.Retail advertisers spent over $820 million in Q2,as compared to $881 million in Q1,2016


The 2016 paid search report by Kantar Media  for retail industry  saw  134,000 retail advertisers spending over $820 million on search ads. In Q2,2016 online retail advertisers targeted  their paid search ads  across 15.5 billion impressions.The chart reflects clickthroughs  and  paid clicks and how they have changed over the last 12 months.

Kantar's AdGooroo's Paid Search Advertising Index report, tracks and measures quarter over quarter activity for 6 key metrics--ad spend, impressions, clicks, CTR ,cost per click and number of advertisers--in 14 different industry including Retail, Jewelry, consumer electronics,home , Flowers and Gifts .The above category shows " the state of paid advertising across  the Retail  industry 


On average, retailers paid more for site visitors originating from paid search in the second quarter, as the average cost per click increased by 7% from Q1 to Q2. However, the total number of clicks and impressions both decreased quarter over quarter, as did total spend, which dropped by 7%, from $881 million in Q1 to $820 million in Q2. The average clickthrough rate remained steady while total number of advertisers dropped by 11%.

Friday, 10 July 2015

Facebook video postings outperforming photo sharing in terms of engagement

Facebook Campaigns by Video Post: Engagement with video posts are up by 25% this yearQ3

" content sharing at Facbook moves to video marketing"
img source: CMO

Marketers are looking to drive more people to their sites as posts with links have increased substantially along with online video links  at Facebook.With Facebook being a source of  more than one third most referral traffic , regular  relevant posting can bring you  targeted and quality traffic 

Video forms quite a substantial form of content  engagement strategy at  Facebook, as the medium provides both dynamism and real time information which users can validate in real time  .Engagement with video posts is up 25% year-over-year and 58% quarter-over-quarter on Facebook 

 In fact text posts have declined quickly in share and engagement. • Posts with video  links are up 77% year-over-year   and 167 every quartner . According to research , Friday is the best day for posting video content on #Facebook.

Thursday, 9 July 2015

UK users are worlds highest spenders on online retail : 5 products they shop online

britain  and denmark lead in online shopping and what they shop for"


Users Britain and Denmark rank among the top 2 nations with highest frequency of online shopping a
75% of UK users shop online and over 52% used online banking in 2014.A whopping 53% UK adults bank online, compared to a mere 30% in 2007.The number of UK users with internet access doubled to 38million in 2014

 What does UK Shop for and  who buys
  1. every 6 of 10 British adults use the internet to buy products such as food, clothing, music or holidays, clothes and sports are most online purchases in UK
  2.  This is twice the average of the OECD’s 34 member states, which include the US, Germany, Australia and France. 
  3. Most bought items in UK apart from clothes  and holidays are consumer electronics ,gaming items  and  household appliances
  4. Seniors shopping online has seen a big jump recently with 40% of them buying online in 2014 
  5. Usage of laptops and tablets has also seen a growth  uptake, in UK from 32 % adults using one in 2013 to 43% according to the ONS

Thursday, 2 July 2015

Sweden. Denmark , Finland and Norway leads in online shopping per 1000 users

 Rank of Nordic nations Sweden. Denmark ,Finland and Norway in online shopping per 1000 users
 These 5  nations  lead by Sweden, Denmark, Finland and Norway lead in online shopping  per 1000 users across all nations. Out of every 1000 users,sweden has  5106 users, Denmark is home of 3133 online users. While Finland and Norway top up the top 5 with 2677 and 2594 online shoppers per 1000 users

Monday, 22 June 2015

Comparison of Online Retail Spending in US : 2012 to 2013

"US online retail spendiding data : 2012 onwards"

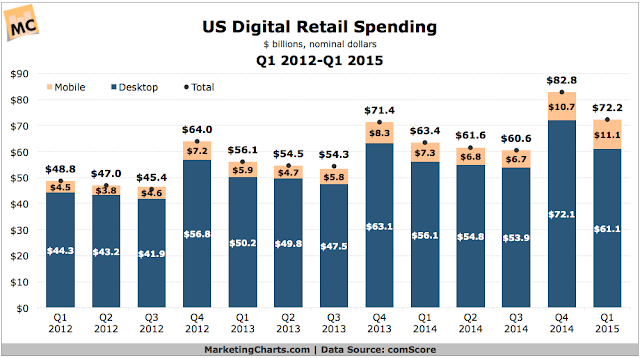
The chart from Comscore shows,US online retail spends  compared from 2012  onwards. In Q42014 Online Retail spending in US reached the highest ever with revenues touching almost $90billion. . Before this the  highest digital spending revenue in US was in Q4, 2013 with spends on $71.4billion

Monday, 15 June 2015

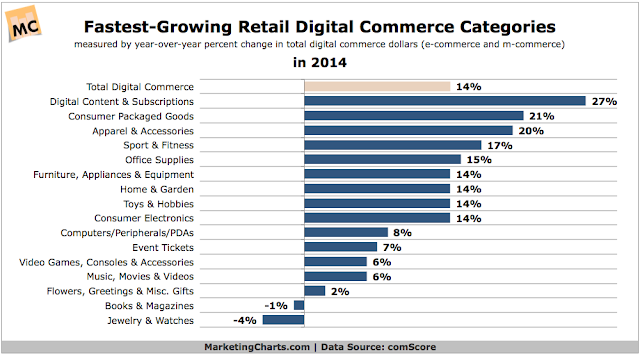
apparels vs gadgets :which category is growing faster online

"fastest growing online product categories "

 Apparels and Accessories  has been growing faster among the two. Historically aparels as product categories  grew by  20%  across the online retail category as compared with 14% growth  in consumer electronics. Data from comscore research shows that Consumer Packaged Goods  lead the product category  which generated a growth of 27% in 2014.